Rate stability improves. Funding risk remains.
The development-selected covariance hedge has 6.50 bp final surplus RMSE versus 15.87 bp for a duration match: 59.03% lower. The paired six-month block 95% interval for the difference is [-12.34, -6.02] bp of initial liability PV.
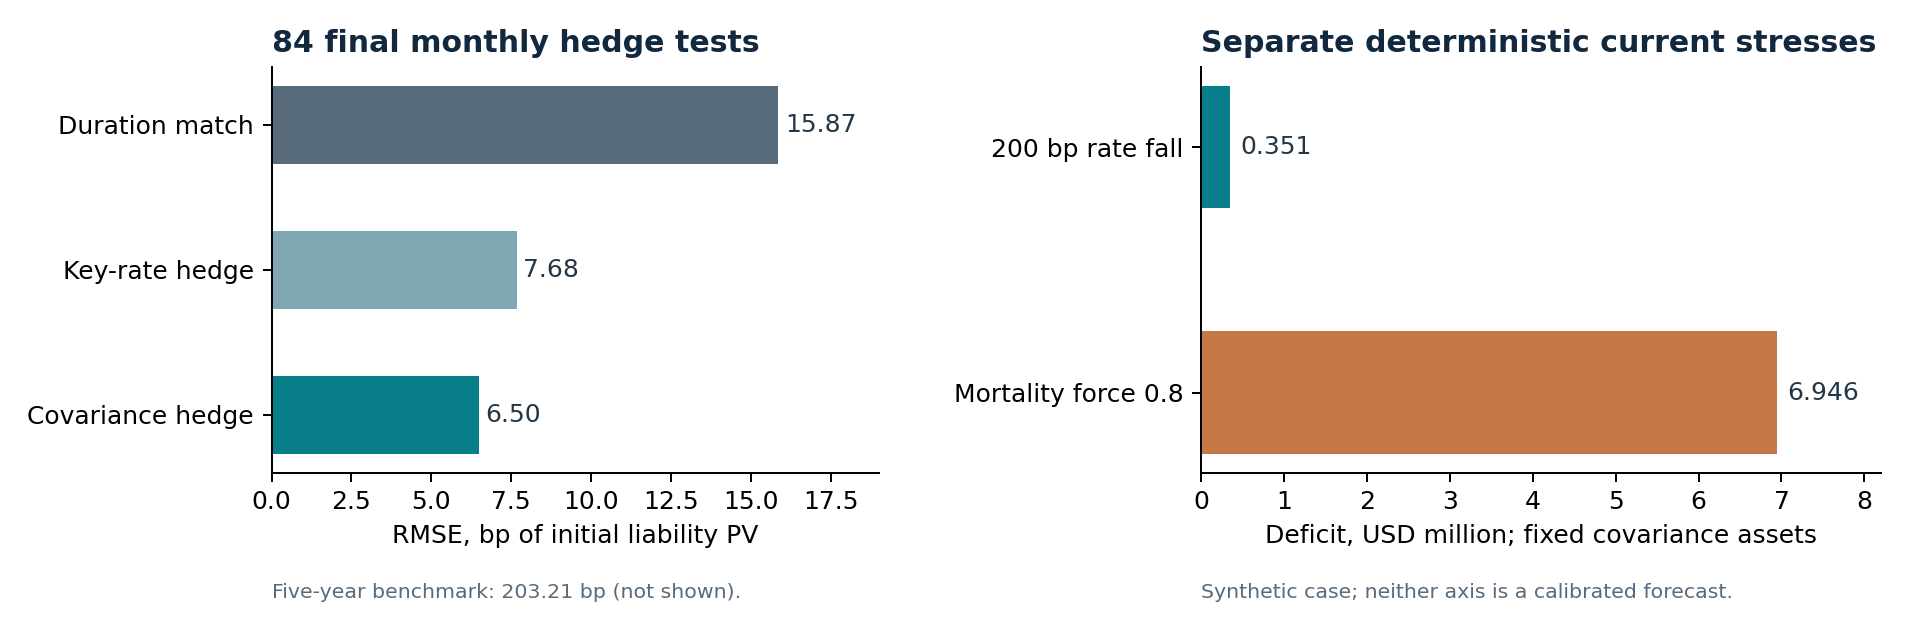
On narrow screens, scroll the chart horizontally. Open the full-size figure.
Compare the four declared hedge candidates
180 training months (2000-2014), 48 development months (2015-2018) and 84 final months (2019-2025). Covariance uses training data only, with fixed 25% diagonal shrinkage. Method selection and predictions were frozen before final scoring.
| Method | RMSE | Mean surplus | Worst surplus | Empirical 5th percentile |
|---|
Changing the inspection portfolio does not change the frozen recommendation. No separate statistical superiority over key-rate is asserted. These reset one-month hypothetical zero-bond experiments use a pinned revised-curve vintage, not immutable point-in-time quotes or a continuous trading strategy.
Separate rate, longevity and tail assumptions
Case date: 30 September 2026. Four 250-life cohorts receive USD 12,000 annually while alive. Base liability USD 119.38 million; duration 8.47 years; liability DV01 magnitude USD 101,157.93/bp. Every stress retains initial asset faces.
Mortality, curve tail and measurement limits
SSA 2023 period mortality describes the US Social Security area, not Indian annuitants or future cohort improvements. The force transformation is q*=1-(1-q)^m. The maximum paying age is 120; later benefits are zero. Curve values beyond 30 years are extrapolated assumptions. DV01 is a positive magnitude: a small positive parallel rate shift reduces liability PV. Deterministic stresses do not estimate probabilities or solvency capital.
Inspect the ten-year liquidity ledger
The complete 4 portfolio x 3 mortality x 3 haircut x 3 cash-shift grid is retained. Zeros mature before benefits; a shortage causes pro-rata sales at initial-curve forward marks less an assumed haircut. This explorer displays saved cases; it does not interpolate or refit.
| Year | Benefits due | Benefits paid | Gross sales | Haircut loss | Closing cash | Remaining assets | Remaining liability | Net funding surplus |
|---|
Download all 1,080 annual records / All 56 instantaneous and 108 runoff results
Follow the result back to its source
Controls that passed
- 31 boundary checks for sources, timing, risk and depletion.
- 23,714 independent Decimal comparisons, including every runoff year.
- 22,166 workbook reconciliations; financial tolerance USD 0.0001.
- Eight scientific outputs reproduced exactly in an isolated full run.
- Seven-sheet workbook export, reopen and changed-input recalculation.
Boundaries retained
- Official US sources and synthetic USD contracts.
- Pinned 2026 historical curve vintage can contain revisions.
- Period mortality and imposed stresses are not forecasts.
- Historical weights and current faces are imported into the workbook, not re-optimised there.
- Native desktop Excel and external independent replication were not tested.
Every final monthly prediction / Final metrics and interval / Full reproduction receipt / Source and public-use ledger
Pinned official source identity
The original Fed CSV is 16,657,704 bytes. All 313 required month-end curves and the current case pass the unchanged 0.02 bp reconstruction rule; two other daily rows remain explicitly quarantined. Raw bytes are preserved.
SHA256:7286435090933f0df1dcaeb15629f3a9129c083baee4c42ae5df03d0bb89335c